


Most barbershop dashboards are rearview mirrors. They show you last month's revenue, how many cuts each barber did, maybe your retail attach rate if you're lucky. Useful, sure — but by the time the number lands in front of you, the thing it describes already happened. You can't un-lose a client who ghosted in March.
The gap between "I have reports" and "I make decisions before the money walks out the door" is wider than most owners realize. And it's not about buying a fancier BI tool. It's about building up your data in stages — each stage unlocking a different kind of question you can actually answer. That staged progression is what the barbershop analytics maturity model is really about: knowing what question you can honestly answer today, and what data you need in place before you can answer the next one.
Below are the four levels, what each one actually requires, and the two predictive use cases where shops see the clearest payback: no-shows and churn.
The four levels, and why skipping one burns you
Each level builds on the one below it. You can't skip to predictive if your descriptive layer is a mess — predictions trained on garbage just produce confident garbage.
| Level | What it answers | Example question | What it needs underneath |
|---|---|---|---|
| 1. Descriptive | What happened? | "How many cuts did we do in October?" | Clean transaction + appointment records |
| 2. Diagnostic | Why did it happen? | "Why did Tuesday revenue drop 18%?" | Linked data (appointments ↔ clients ↔ barbers) |
| 3. Predictive | What's likely to happen? | "Which clients are about to stop coming?" | Historical patterns + outcome labels |
| 4. Automated decisions | What should we do about it? | "Trigger a win-back offer to at-risk regulars automatically" | Scored predictions wired into workflows |
The mistake shops make constantly: they want level 3 predictions but their level 1 data has three spellings of the same client, no-shows recorded as "cancellations," and two barbers sharing one login. You can't forecast churn when you can't even tell who a repeat client is.
Maturity here is sequential. Each level has a minimum data contract — a short list of fields that must be clean and consistent — before the next level becomes possible.
Level 1: Descriptive — get the raw record right
This is the boring foundation, and it's where most of the real work lives.
Never miss a booking amidst the hustle.
Trimzly helps you schedule, confirm, and manage every client visit seamlessly.
- Unified appointment management
- Automated client reminders
- Optimized staff scheduling
No credit card required
Minimum data contract for Level 1:
-
Every appointment has
a timestamp, a client ID, a barber ID, a service type, and a final price
-
Every no-show and cancellation is recorded as its own status, not deleted or lumped into "completed"
-
Retail sales tie back to the same client ID when possible
-
One client = one record (no duplicates from phone-number typos)
That last point is the killer. If a client books under "Mike," "Michael," and a different phone number across six months, your system sees three people who each came twice instead of one loyal regular who came six times. Everything downstream breaks.
If your records are scattered across a booking app, a separate POS, and a notebook behind the register, fix that first. We've written separately about building a single source of truth for your shop's data — that groundwork is non-negotiable before you climb higher.
Milestone dashboard for Level 1 (you've passed this level when you can glance at these without manual cleanup):
-
Daily/weekly revenue by barber and by service
-
Appointment volume vs. capacity (chair utilization)
-
No-show and cancellation count as a clean, separate number
-
Retail attach rate
A typical Level 1 failure: a shop reported "92% booked" every week and still felt broke. Turned out cancellations were being overwritten, so booked slots that emptied still counted as filled. Their utilization number was fiction. Once they separated the statuses, real utilization was closer to 74%, and suddenly the revenue made sense.
Level 2: Diagnostic — stop guessing at *why*
Descriptive tells you Tuesday was down. Diagnostic tells you Tuesday was down because your two senior barbers both had the week off and walk-ins got a less experienced cut and didn't rebook.
To get here, your data has to be linked, not just recorded. An appointment isn't a standalone row — it connects to a client history, a barber, a time slot, and ideally a source (walk-in vs. online vs. referral).
Minimum data contract for Level 2:
-
Appointments joined to full client history (first visit date, visit count, lifetime spend)
-
Barber-level outcomes trackable (rebook rate per barber, not just revenue)
-
Booking source captured on every appointment
-
Time-of-day and day-of-week segmentation available
The insight most owners miss at this level: rebook rate per barber is one of the most diagnostic numbers in the whole shop. Two barbers can do identical cut volume, but if one sends 65% of clients out with a next appointment booked and the other sends 30%, you've found a revenue leak that no revenue report would ever show you.
Milestone dashboard for Level 2:
-
Rebook rate segmented by barber, service, and booking source
-
Revenue variance explained (when a week is down, which segment drove it)
-
New vs. returning client mix over time
-
Service-mix drift (are high-margin services shrinking?)
This is also where client segmentation starts paying off. Once you can see who your regulars, lapsing clients, and one-timers are, you can act differently toward each group — the mechanics of which we covered in depth in our guide on segmenting clients to lift rebook rates.
Level 3: Predictive — the first real leap
Now it gets interesting. Predictive means using your historical patterns to score future risk and opportunity. You don't need a data scientist for this. You need clean labeled history and a willingness to start simple — and simple genuinely outperforms what most shops do, which is nothing.
Predictive use case #1: No-show forecasting
The goal: for every upcoming appointment, estimate the probability it won't show, so you can prioritize reminders, double-book strategically at known-risky slots, or require deposits for the highest-risk bookings.
Light ML requirements — a sample dataset might look like this:
| client_id | lead_time_days | prior_no_shows | prior_visits | day_of_week | time_slot | booking_source | **no_show (label)** |
|---|---|---|---|---|---|---|---|
| 1042 | 14 | 2 | 9 | Mon | 9:00 | online | 1 |
| 2210 | 1 | 0 | 22 | Sat | 13:00 | phone | 0 |
| 3381 | 7 | 1 | 3 | Wed | 18:00 | walk-in-rebook | 0 |
The pattern that shows up almost everywhere: long lead times plus a history of prior no-shows plus a first-thing-in-the-morning slot is a high-risk combination. A client who booked three weeks out at 9am and already flaked once is a very different risk than a loyal Saturday regular who booked yesterday.
Even a basic logistic regression or a simple decision tree on those columns will meaningfully beat flat reminders-for-everyone. You're not chasing a perfect model — you're ranking appointments by risk so your attention and your deposit policy go where they matter.
Predictive use case #2: Churn forecasting
Churn in a barbershop is sneaky because there's no cancellation event. Clients don't quit — they just quietly stop coming. The signal is absence, and absence is exactly what reports don't surface.
Sample churn-signal dataset:
| client_id | avg_days_between_visits | days_since_last_visit | visit_count | lifetime_spend | last_rebook_booked | **churned (label)** |
|---|---|---|---|---|---|---|
| 1042 | 21 | 47 | 9 | $340 | no | 1 |
| 2210 | 28 | 25 | 22 | $980 | yes | 0 |
| 3381 | 56 | 40 | 3 | $75 | no | 0 |
The engineered feature that does most of the heavy lifting is dayssincelast_visit divided by that client's own average gap. When that ratio climbs past ~1.5, the client is drifting. Past 2.0, they're most likely gone unless you reach them.
The pattern worth internalizing: clients who didn't leave with a rebooked appointment churn at a dramatically higher rate than those who did. Which loops right back to that Level 2 rebook-rate insight. Everything connects.
Level 4: Automated decisions — predictions that actually do something
A prediction sitting in a dashboard nobody opens is worthless. Level 4 is where scored predictions get wired into real workflows so the right action fires without you remembering to check.
In practice that looks like:
-
A client crosses the churn-risk threshold → a win-back message or offer queues automatically
-
An upcoming appointment scores high no-show risk → it gets an extra confirmation touch or a deposit request
-
A high-value regular hits their rebook window with no booking → a personal nudge goes out
This is where AI-powered operational platforms start to earn their place — not because AI is magic, but because the scoring, triggering, and messaging happen in one connected system instead of you exporting a CSV every Monday and manually texting people. The automation isn't the point; the point is that the decision happens close to the data and close to the moment it matters.
The honest warning about Level 4: don't automate decisions you haven't validated manually first. Run your churn scores for a month and eyeball whether the "at-risk" list actually matches who's slipping. Automate only after the predictions earn your trust. Shops that jump straight to automated win-back blasts end up spamming loyal clients who were never leaving and burning goodwill.
Here's a simple workflow visualization.
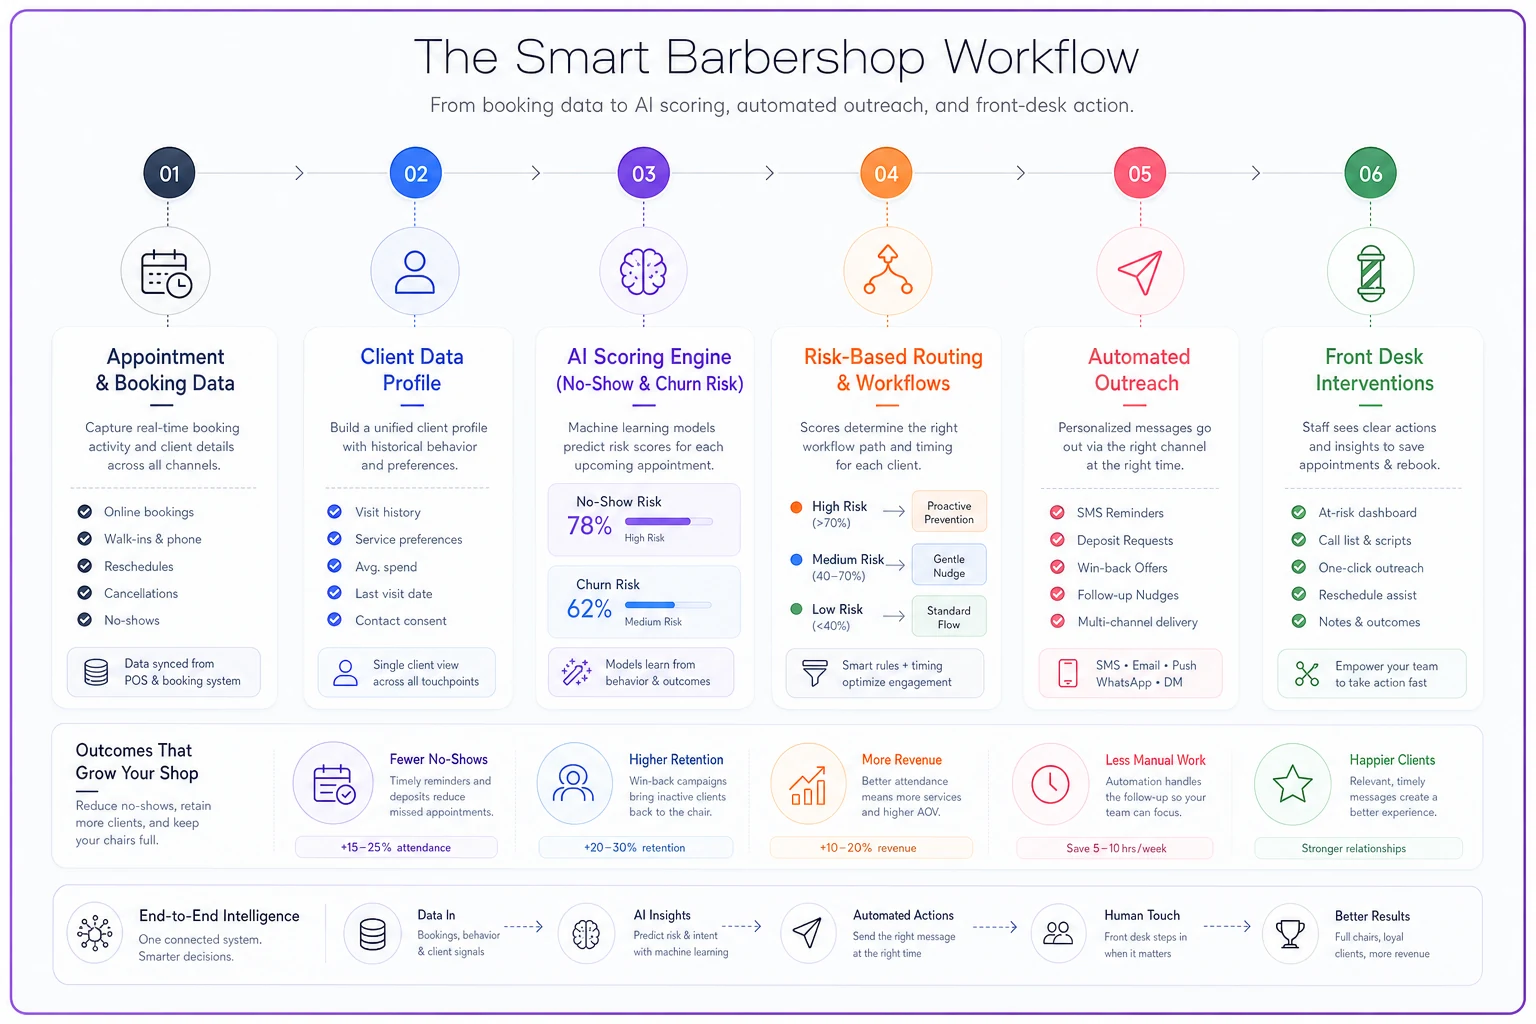
The automation isn't the point; the point is that the decision happens close to the data and close to the moment it matters.
Shops that jump straight to automated win-back blasts end up spamming loyal clients who were never leaving and burning goodwill.
A real scenario: from reports to action
A three-chair shop doing roughly 320–360 appointments a month had decent descriptive reports and basically ignored them. Their recorded no-show rate sat around 9%, and their returning-client percentage had been quietly sliding for two quarters without anyone naming it.
They did three things over about ten weeks:
-
Cleaned up duplicate client records so visit histories were real (Level 1 fix)
-
Started tracking rebook rate per barber and flagging clients past 1.5× their normal visit gap (Levels 2–3)
-
Set a simple rule
any high-value regular past their window with no booking got a personal text from the front desk
No fancy model. Just the ratio feature and a consistent follow-up. Over the following quarter, the slow bleed in returning clients flattened out and then ticked back up a few points, and roughly a dozen regulars who'd gone quiet came back in. The no-show work came next, mostly by requiring small deposits on the highest-risk long-lead-time slots.
Nothing dramatic month to month. But the trajectory changed, and that's the whole game with this — you're bending a slow curve, not hitting a jackpot.
When to climb each level (and when to stop)
When pushing to the next level makes sense:
-
Your current level's dashboards are clean and you trust them without manual fixes
-
You have at least 6–12 months of consistent history to learn patterns from
-
You have someone who'll actually act on what the data says
When it's a bad idea:
-
Your Level 1 data is still messy — fix that first, always
-
You're a solo barber with 40 regulars you know by name; you don't need churn modeling, you need a notebook
-
You'll build the prediction but have no workflow to act on it
Who should NOT chase Level 4 yet: any shop that hasn't validated its predictions by hand for a few weeks. Automating a model you haven't sanity-checked is how you annoy your best clients.
The checklist to find your current level
Run through this honestly:
-
[ ] One client = one clean record (no duplicates)
-
[ ] No-shows and cancellations recorded as distinct statuses
-
[ ] Retail ties to client IDs
-
[ ] Rebook rate visible per barber
-
[ ] Booking source captured on every appointment
-
[ ] You can explain why a down week was down
-
[ ] You have 6+ months of linked history
-
[ ] You've defined churn relative to each client's own rhythm
-
[ ] At least one prediction is validated manually before any automation
-
[ ] A clear workflow exists to act on each prediction
If you're checking the first four, you're solidly at Level 1–2. The back half is where predictive lives. And this ladder connects to the money side too — knowing which clients are drifting ties directly into protecting the retail and add-on revenue you worked to build, which we broke down in the retail and add-on revenue system.
What to actually take away from this
You don't need to be "data-driven" in some abstract way. You need to climb one level at a time, because each level fails loudly if the one below it is broken. Clean records before you diagnose. Diagnose before you predict. Predict and validate before you automate.
Most shops are stuck at Level 1 staring at revenue reports, wondering why they can't see trouble coming. The reason is straightforward: reports describe the past, and the clients you're about to lose are a future-tense problem. Move up the ladder, and your software stops being a scorekeeper and starts being an early-warning system.
Ready to elevate your barbershop operations?
Join 500+ barbershops using Trimzly to save time, reduce scheduling conflicts, and enhance client satisfaction.