


Most barbershop owners treat lifetime value like a trophy number. They read somewhere that "a client is worth $2,400 over their life," slap it on a whiteboard, and never touch it again. The problem isn't that the number is wrong. The problem is that a single blended LTV figure can't tell you anything you can actually do on Monday morning.
What moves the needle is breaking LTV apart by cohort — grouping clients by when they first walked in and watching how each group behaves over time. Once you do that, LTV stops being a vanity stat and becomes a control panel: it tells you which acquisition channels are worth funding, which retention tactics pay for themselves, and where you're quietly bleeding money you didn't know you had.
This is the version of a barbershop lifetime value model that a busy owner can actually run — with worksheets you can copy, segment-level budgets you can set, and a rhythm for turning all of it into weekly tests.
Why a single LTV number lies to you
Say your shop does roughly $28k–$32k a month, and you calculate that the average client is worth about $2,100 over three years. Feels useful. But that average is hiding two completely different businesses operating inside your one shop.
Group A: clients who found you on Google, booked a fade, came back every three weeks, and eventually started buying pomade. Their real lifetime value might be closer to $3,800.
Group B: clients who came in on a 50%-off first-cut promo, got exactly what they paid for, and never returned. Their lifetime value barely clears the discounted first visit — maybe $18.
When you blend those into one number, you get $2,100, and that number tells you to keep doing everything you're currently doing. But the two groups need opposite decisions. Group A deserves more acquisition budget. Group B is a leak you should either fix or stop funding altogether.
This is the core insight most owners miss: LTV only becomes actionable when it's tied to how clients entered your shop and how their cohort behaved afterward. The "how they entered" part connects directly to CAC (customer acquisition cost), and the "how they behaved" part connects to retention. When those two things live in the same worksheet, budgets stop being guesses.
The cohort worksheet, built for a shop (not a spreadsheet wizard)
A cohort is just a group of first-time clients bucketed by the month they first came in. You track each month's group forward — how many came back in month 1, month 2, month 3, and so on — and multiply surviving clients by their average spend.
Never miss a booking amidst the hustle.
Trimzly helps you schedule, confirm, and manage every client visit seamlessly.
- Unified appointment management
- Automated client reminders
- Optimized staff scheduling
No credit card required
| First-visit month | New clients | Avg first ticket | Retained @ 30d | Retained @ 90d | Retained @ 180d | Revenue per client (6mo) |
|---|---|---|---|---|---|---|
| January | 46 | $32 | 61% | 44% | 33% | $118 |
| February | 39 | $30 | 58% | 41% | 30% | $109 |
| March | 52 | $34 | 65% | 49% | 38% | $141 |
A few things worth knowing about how to actually read this:
-
Retained @ 30d is the share of that month's new clients who booked a second visit within 30 days. This is your single most predictive number. If a first-timer doesn't rebook inside their first 30–35 days, the odds they ever become a regular fall off hard.
-
Revenue per client (6mo) is what you actually earned per person acquired in that cohort, six months out. This is the number you compare against CAC.
-
The gap between January and March isn't random. March had a better 30-day rebook rate, and that single difference cascades into everything downstream.
The mistake most shops make is tracking appointments instead of people. Your booking software counts visits. A cohort worksheet counts humans and follows them. Those are different questions, and only the second one tells you if acquisition is working.
If your intake and follow-up isn't tight enough to even measure that 30-day window, that's the first thing to fix — the mechanics of converting a first cut into a booked second visit are covered in depth in turning first-time walk-ins into lifetime customers, and you can't run a useful cohort model until that pipeline exists.
Tying CAC to cohorts (this is where the money decisions live)
CAC is what you spent to get a client, divided by clients acquired, per channel. Not blended. Per channel. The whole point is comparing channels against each other.
| Channel | Spend (quarter) | New clients | CAC | 6-mo revenue/client | Rough 6-mo ratio |
|---|---|---|---|---|---|
| Google Business Profile | $0 (time only) | 71 | ~$4 | $138 | very high |
| Local Instagram ads | $1,900 | 58 | $33 | $121 | ~3.6x |
| First-cut discount promo | $2,400 | 94 | $26 | $41 | ~1.6x |
| Referral incentive | $600 | 22 | $27 | $166 | ~6.1x |
Look at what this exposes. The discount promo pulled in the most clients and looked like a winner in the appointment count. But that cohort barely came back — a 6-month ratio of 1.6x means you're just about breaking even after paying to acquire people who don't stick. The referral channel brought in fewer bodies, but those clients were worth six times what it cost to get them.
An owner staring only at booking volume would double down on the promo. An owner reading cohort-level CAC would shift budget toward referrals and organic, and either kill the discount or restructure it so it stops attracting one-and-done clients.
The pattern worth internalizing: cheap-to-acquire clients from discount channels almost always have the worst retention, and the acquisition cost you "saved" gets eaten by the revenue you never earn. The real cost of a client isn't the ad spend. It's the ad spend divided by whether they come back.
Segment-level acquisition budgets
Once you can see CAC and cohort revenue side by side, budgeting becomes almost mechanical. You fund channels in proportion to their proven return, cap the leaky ones, and hold a slice back for testing.
A workable split for a shop spending roughly $2k–$3k a month on acquisition:
-
50–60% into proven high-ratio channels. Whatever your version of the referral/organic winners are. These are earning their keep and deserve more fuel.
-
20–25% into mid-tier channels. Paid social or local partnerships returning 3x–4x. Solid, not spectacular, worth maintaining.
-
10% into an experiment budget. New channels, new offers, segments you haven't tested. This is your R&D line, and it should never be zero.
-
The rest, tightly capped, into any discount/promo channel — and only if you've redesigned the offer to actually improve retention, not just volume.
Keep the experiment budget at about 10% so you can test without jeopardizing proven channels.
The important discipline: a channel doesn't earn more budget because it brings volume. It earns more budget because its cohort comes back. That's the rule that keeps you from pouring money into a leaky funnel just because the top of it looks busy.
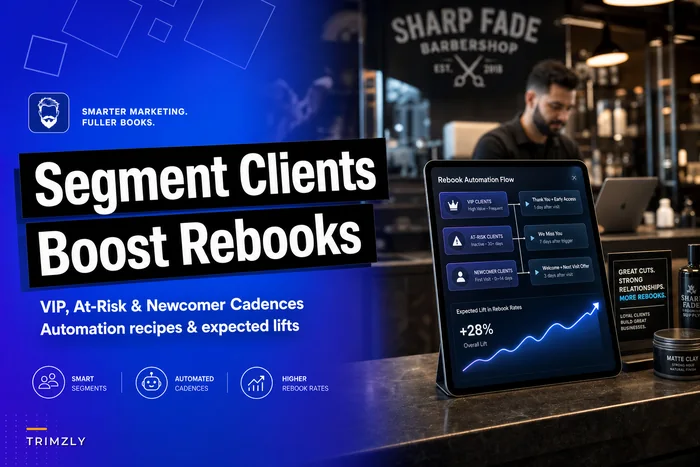
Different client segments also justify different acquisition spend. A client who comes in for a $22 buzz every four weeks and never buys product has a very different lifetime value than one who books a $45 cut-and-beard, picks up retail, and rebooks every two weeks. You can afford to spend more acquiring the second type. Segmenting your clients this way — and tailoring how you communicate with each group — is its own discipline, and the client segmentation and rebook cadence approach pairs directly with this budgeting logic.
Retention tactics, ranked by what they actually do to a cohort
Retention is the highest-leverage part of the entire model, because a small bump in the 30-day rebook rate reshapes the whole cohort curve. Raising retention is almost always cheaper than raising acquisition — and it improves the return on every acquisition dollar you've already spent.
-
Book the next appointment before they leave the chair. This single behavior moves 30-day rebook more than almost anything else. Shops that make "want me to lock in your next one?" a standard closing line often see rebook rates jump 10–15 points.
-
A follow-up nudge at day 21–25. Timed just before a typical client would start looking shaggy. Not a generic blast — a specific "you're about due" message tied to their last service.
-
A structured second-visit offer. Not a discount that trains them to wait for deals, but something that reinforces the relationship — a free hot-towel add-on, a product sample.
-
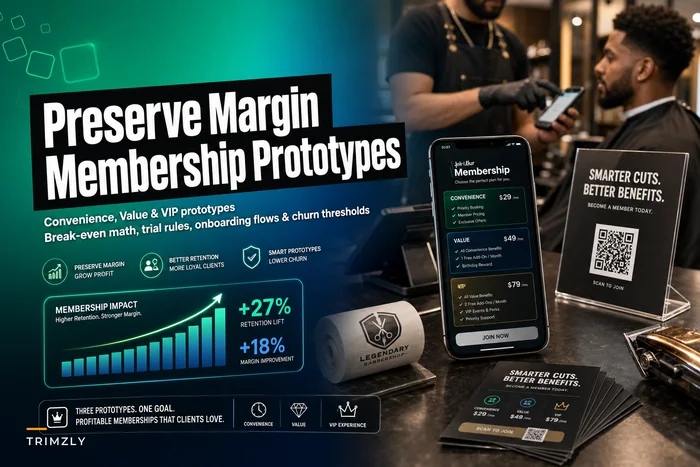
Membership, carefully. Memberships can dramatically extend cohort life or quietly destroy your margin depending on how they're priced. It's a real trap, and the three membership prototypes that preserve margin are worth reading before you launch anything recurring.
The biggest retention gains almost never come from a flashy new program. They come from making the first rebook frictionless and timely. Everything downstream compounds from that first return visit.
The weekly rhythm: turning LTV into experiments and budget rules
Here's a roadmap that turns the numbers above into a weekly operating habit.
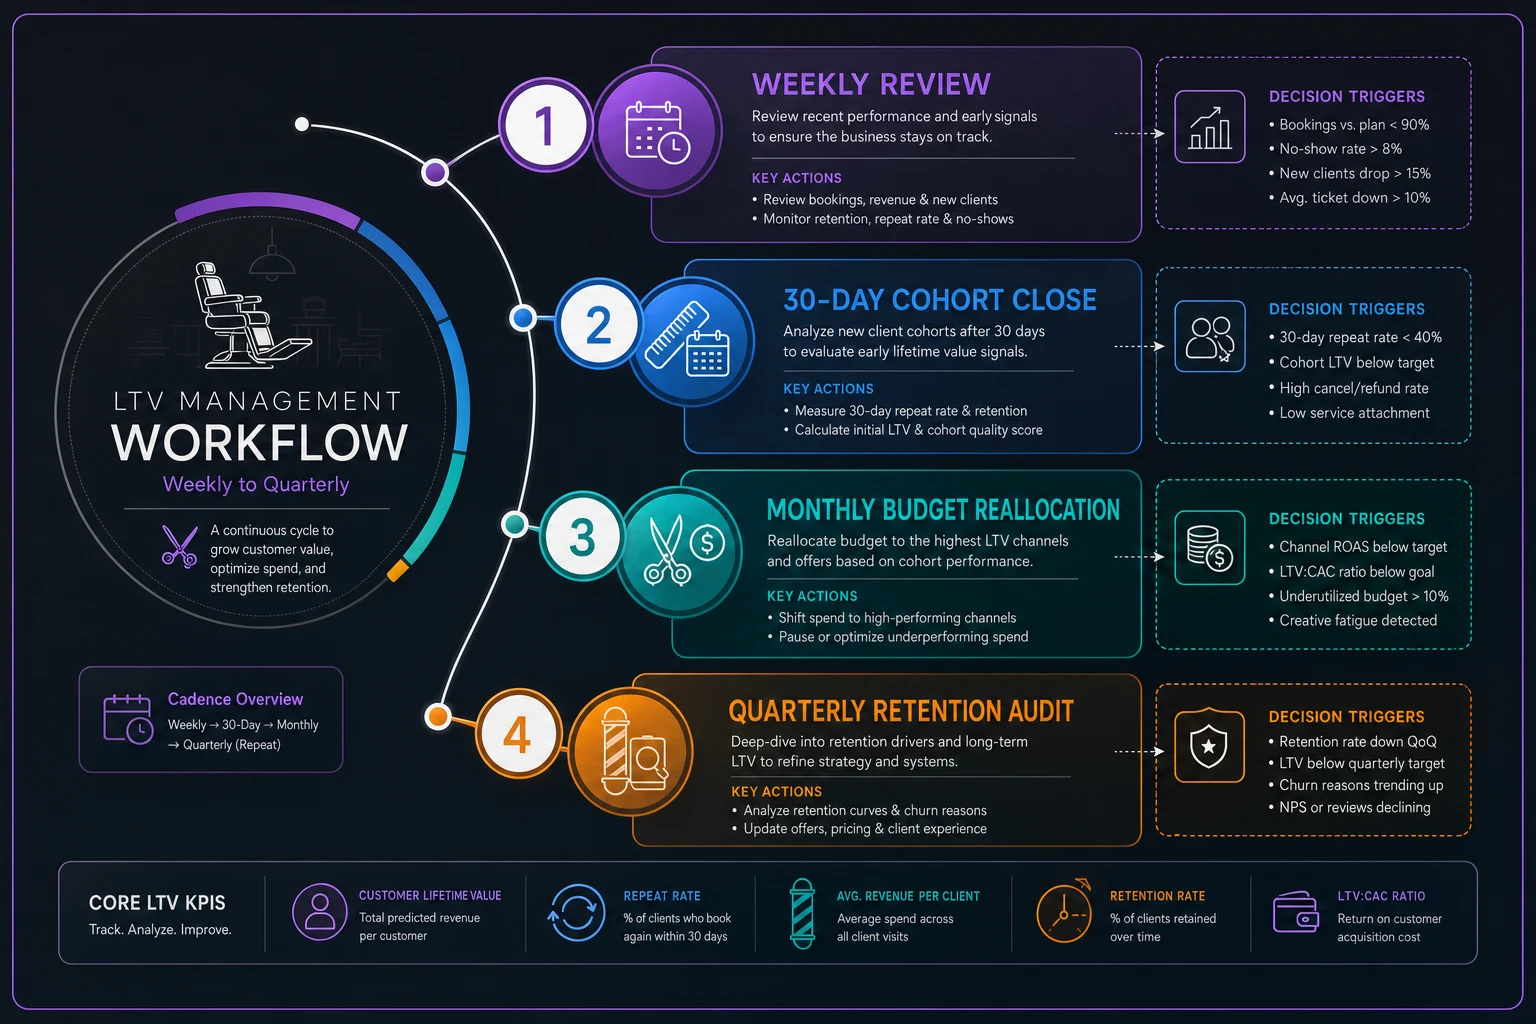
Weekly (15 minutes):
-
Check last week's new clients and how many prior first-timers rebooked.
-
Log 30-day rebook rate for the cohort aging into that window now.
-
Note any channel where CAC is drifting up.
Monthly:
-
Close out the completed cohort's 30-day numbers.
-
Compare CAC-to-revenue ratios across channels.
-
Shift 5–10% of budget from the lowest-ratio channel to the highest.
-
Pick one retention experiment to run next month.
Quarterly:
-
Review 90-day and 180-day cohort revenue.
-
Re-set the segment-level budget split.
-
Kill any channel that's been below roughly 2x for two consecutive quarters.
The experiment rule that keeps this honest: change one thing at a time, and give each cohort at least 30 days before you judge it. If you tweak your promo, your follow-up message, and your booking script all in the same week, you'll never know which one moved the number. Slow is smooth here.
This is also where keeping your data in one place stops being optional. If booking history lives in one system, client contact info in another, and ad spend in a spreadsheet you update when you remember, building cohorts each month becomes a painful manual chore — and painful chores don't get done. An operational platform that ties bookings, client records, and follow-up messaging together makes the monthly cohort update take minutes instead of an afternoon. That's the real difference between a model you actually run and one you abandon after the first month.
A real scenario
A two-chair shop doing around $24k a month was running a standing 40%-off first-cut promo because it "filled the calendar." It did — the shop stayed busy. But profit was flat and the owner couldn't figure out why.
When they finally split clients into cohorts, the picture was rough. The promo cohort had a 30-day rebook rate of about 19%. Their organic and referral cohorts sat around 55%. The promo was bringing in bodies worth almost nothing past the first visit, and the discounted first cut plus the chair time was actively costing money.
They did three things over the following quarter: cut the blanket discount, redirected that budget into a referral incentive plus consistent Google Business Profile activity, and added a "book your next" script plus a day-23 follow-up nudge. Nothing exotic.
Six months later the shop was doing roughly $27k–$29k a month — not a massive revenue jump — but profit improved meaningfully because the new clients were the kind who came back. The 30-day rebook rate across all new clients climbed into the high 30s. The calendar looked slightly less frantic and the shop made more money. That's what a working LTV model actually does: it trades busy for profitable.
When this approach makes sense — and when it doesn't
It makes sense when you have at least a few months of client history, you're spending real money on acquisition, and you're big enough that a bad channel decision costs you meaningful cash. A shop with two or more chairs and any kind of ad spend should be running cohorts.
It's overkill when you're a brand-new solo barber still building a book. In your first six months, you don't have enough cohort data to model anything — your job is simply to get people to come back and start capturing the data cleanly. Come back to this once you've got some history.
Who should not do this: anyone who's going to build the worksheet once, admire it, and never update it. A cohort model that isn't maintained monthly is worse than no model, because it gives you stale confidence. If you can't commit to the 15-minute weekly and the monthly review, fix your follow-up basics first and add the model when you're ready to actually use it.
The bigger picture
Every part of your shop connects through the client relationship. Acquisition spend, booking scripts, follow-up timing, product sales, pricing, membership design — none of them are separate levers. They all show up in the cohort curve, and the cohort curve is just lifetime value made visible over time.
When you can see which clients came from where, how long they stayed, and what they were worth, you stop making decisions based on which day felt busy and start making them based on which clients actually built the business. That shift — from gut to cohort — is what separates a shop that stays flat for years from one that quietly compounds.
The math isn't hard. The discipline of looking at it every week is the whole game.
Ready to elevate your barbershop operations?
Join 500+ barbershops using Trimzly to save time, reduce scheduling conflicts, and enhance client satisfaction.