
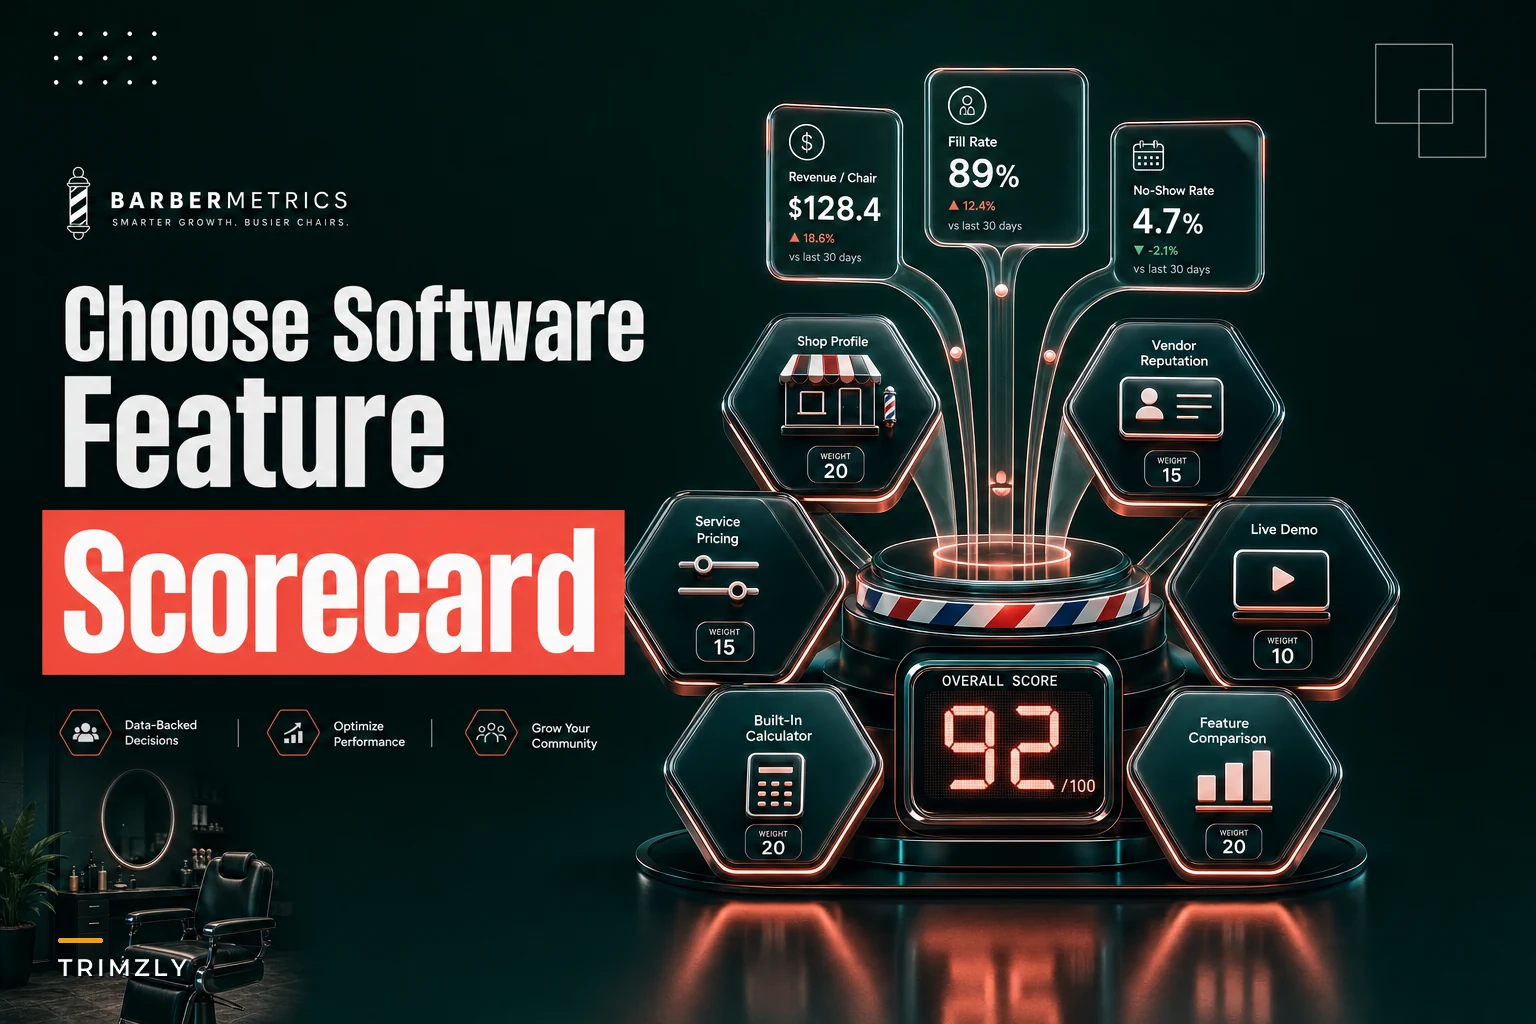

Most software comparisons go sideways for one reason: owners end up staring at feature grids. Tool A has 142 features, Tool B has 118, so Tool A wins, right? Except half those features never get used, and the three that actually move money are buried somewhere on page four of a sales deck.
The better question isn't "what can this software do?" It's "which features change a number I actually care about?" Revenue per chair. No-show rate. Add-on attach. Booking fill. Those numbers pay your rent. Everything else is decoration.
So this is a scoring framework, not a feature list. Take the 12 features that show up in almost every barber shop management software demo, map each one to the KPI it's supposed to influence, then weight those features based on what your specific shop needs. A solo barber and a three-location group care about wildly different things, and treating them the same is how people end up paying for modules they'll never open.
We'll build the scoring matrix, run it through three shop profiles, get into the vendor questions, and cover the one-month pilot that tells you whether any of this is real.
The 12 features and the KPIs they actually move
Each feature connects to one or two measurable business outcomes. If a feature doesn't connect to anything measurable, it's a nice-to-have — and nice-to-haves should never drive a buying decision.
| Feature | Primary KPI it affects | How it actually moves the number |
|---|---|---|
| Online booking | Booking fill rate | Captures after-hours and impulse bookings you'd otherwise lose |
| Chair-level scheduling | Revenue per chair, labour efficiency | Matches barber availability to demand instead of guessing |
| POS / payments | Add-on attach, labour efficiency | Faster checkout, retail prompts at the point of sale |
| Inventory | Inventory turns, margin | Prevents dead stock and stockouts on fast movers |
| Payroll | Labour efficiency | Ties hours and commission to actual booked revenue |
| Reporting | Everything (it's the measurement layer) | You can't improve what you can't see |
| Integrations | Labour efficiency | Removes double-entry between tools |
| APIs | Future flexibility | Lets you connect custom tools without ripping everything out |
| Loyalty | Rebook rate, visit frequency | Nudges clients back before they drift |
| Memberships | Revenue predictability, no-show rate | Prepaid clients show up more reliably |
| Multi-location support | Cross-shop labour efficiency, reporting | One view across shops instead of five spreadsheets |
| Data portability | Switching cost / risk | Determines whether you're trapped later |
Notice how a few features — reporting, integrations, data portability — don't move a revenue KPI directly. They're enablers. Underweight them and you'll buy something that looks great in month one and becomes a cage by month eight.
The feature everyone overvalues
Loyalty points. In demo after demo, loyalty is the thing that makes owners lean forward. It feels like growth. But in real operations, a poorly built loyalty program just hands discounts to clients who were already coming in every three weeks. It doesn't create new frequency — it subsidizes existing frequency. If loyalty is going to score high in your matrix, it needs to be the kind that targets lapsing clients specifically, not a blanket points engine.
The feature everyone undervalues
Data portability. Nobody gets excited about export formats. But the single most expensive software mistake isn't picking the wrong tool — it's getting locked into one and discovering, two years later, that your entire client history, appointment photos, and service notes can only leave as a messy CSV with half the fields missing. Weight this higher than feels natural. You will thank yourself.
Building your scoring matrix
The mechanics are straightforward. For each of the 12 features, you assign two numbers:
Never miss a booking amidst the hustle.
Trimzly helps you schedule, confirm, and manage every client visit seamlessly.
- Unified appointment management
- Automated client reminders
- Optimized staff scheduling
No credit card required
-
A weight (1–5) based on how much that feature matters to your shop profile.
-
A score (1–5) for how well a given vendor actually delivers it.
Multiply weight × score per feature, add it all up, and you get a single comparable number per vendor. The weights are where judgment lives. The scores are where the demo and pilot come in.
Here's the process:
-
Pick your shop profile (solo, 4–8 chair, or small group). Use the sample weights below as a starting point.
-
Adjust any weight that doesn't match your reality. If you don't sell retail, drop inventory's weight. If you're drowning in no-shows, bump memberships.
-
Shortlist two or three vendors. Don't score ten — you'll lose the thread.
-
Score each vendor 1–5 per feature, based on the demo and your vendor questions.
-
Calculate weighted totals. The winner is rarely the one with the most features. It's the one that scores highest on your heavily weighted rows.
This process forces disagreement into the open. If you and your manager score the same vendor's reporting a 2 and a 5, that gap is a conversation worth having before you sign anything.
WEIGHTED SCORING WORKFLOW
-
Step 1
Define shop profile
-
Step 2
Set weights (1–5) per feature
-
Step 3
Shortlist 2–3 vendors
-
Step 4
Score each vendor (1–5) per feature via demo + pilot
-
Step 5
Multiply weight × score per feature
-
Step 6
Sum totals per vendor
-
Step 7
Compare — highest weighted score wins
Here's a quick visual of the weighted scoring workflow.
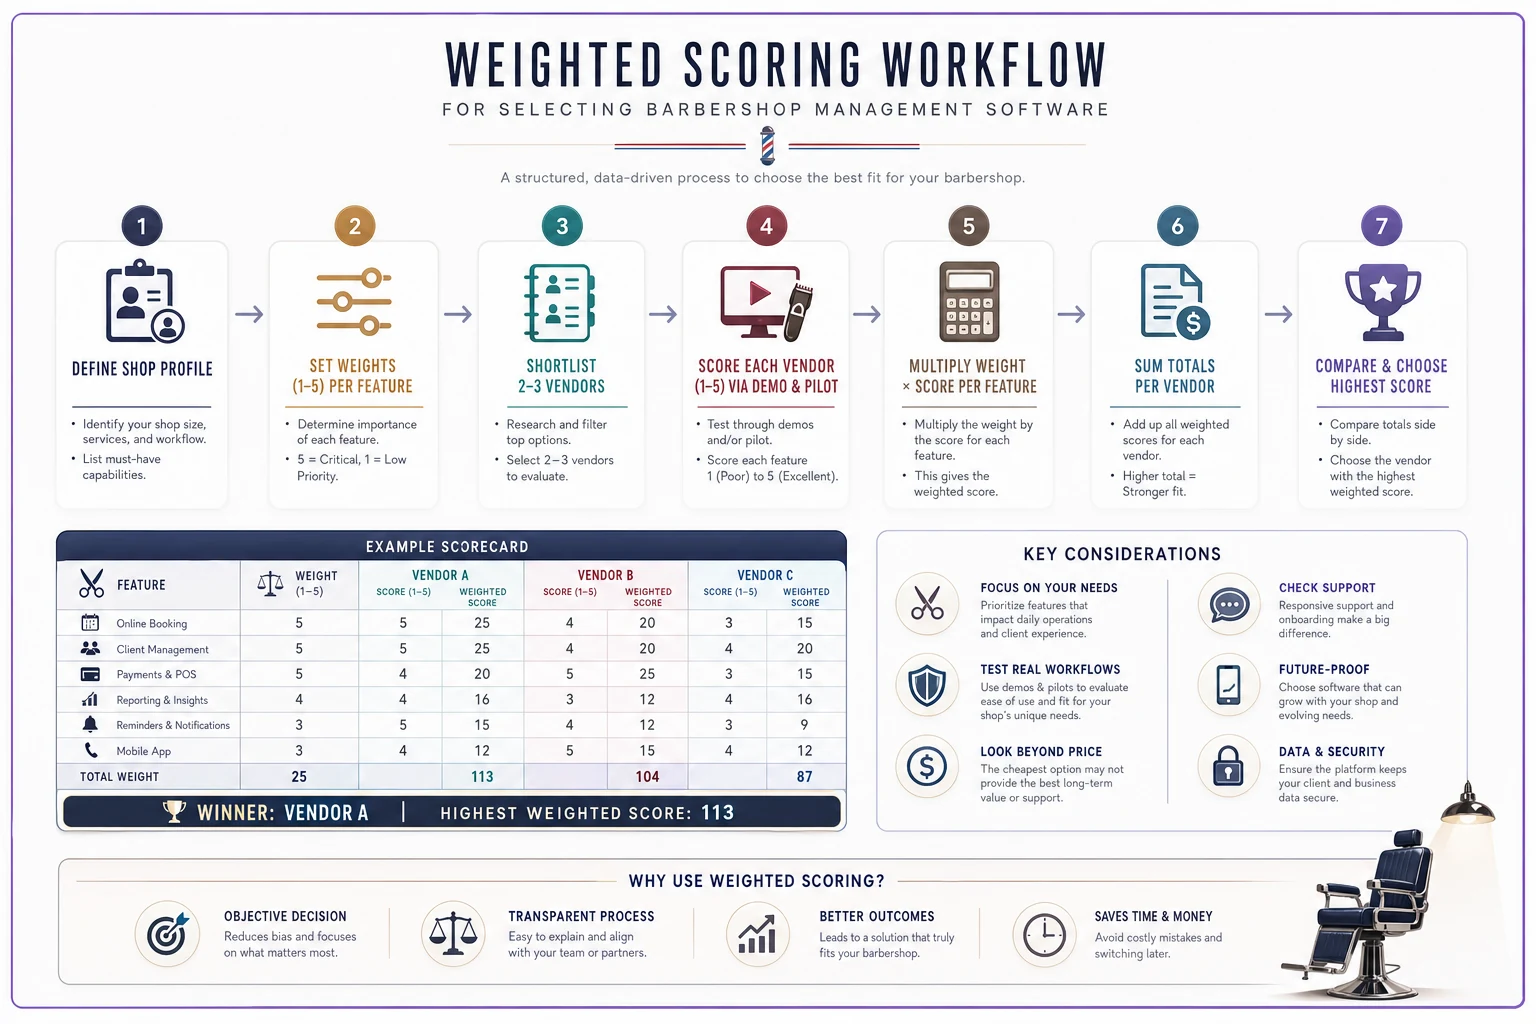
Use this visual as a checklist while running demos and pilots.
Sample weightings for three shop profiles
These are starting points. Treat them as a first draft, not gospel.
Solo / single-chair or single operator
-
Online booking
5
-
POS / payments
5
-
Chair-level scheduling
2 (you're one chair)
-
Inventory
2
-
Payroll
1
-
Reporting
3
-
Integrations
2
-
APIs
1
-
Loyalty
3
-
Memberships
4
-
Multi-location
1
-
Data portability
4
Solo operators tend to overbuy. They get sold multi-location dashboards and payroll suites they'll never touch. Keep it lean. Online booking and fast payments carry most of the value.
4–8 chair shop
-
Online booking
5
-
Chair-level scheduling
5
-
POS / payments
4
-
Inventory
4
-
Payroll
4
-
Reporting
4
-
Integrations
3
-
APIs
2
-
Loyalty
3
-
Memberships
4
-
Multi-location
1
-
Data portability
4
Scheduling is usually what breaks at this size. When you've got six barbers with different hours, different skill sets, and different followings, a scheduling engine that handles chair-level nuance is the difference between full chairs and awkward gaps. A proper chair-level scheduling framework pairs well with the software here — the tool enforces what your system defines.
Small group / multi-location
-
Online booking
4
-
Chair-level scheduling
4
-
POS / payments
4
-
Inventory
4
-
Payroll
5
-
Reporting
5
-
Integrations
5
-
APIs
4
-
Loyalty
3
-
Memberships
4
-
Multi-location
5
-
Data portability
5
The trap at this stage: buying a tool that technically supports multiple locations but treats each one as a separate silo. "Multi-location support" on a feature sheet can mean anything from true consolidated reporting to "you can log into different accounts." Score this harshly in the pilot.
The vendor question checklist
Demos are performances. The salesperson drives, everything works, and the data is fake. Your job is to break the performance with questions that expose the real product. Ask these directly:
-
"Show me a client's full history being exported right now." Not described — exported. If they hesitate, data portability is weak.
-
"What happens to a booking if your system goes down during business hours?" You're testing their offline/failover story.
-
"How does chair-level scheduling handle a barber who only does certain services?" Tests whether scheduling is real or cosmetic.
-
"Walk me through a refund on a membership mid-cycle." Edge cases reveal product maturity.
-
"What does your reporting show for revenue per chair, by barber, last 30 days?" If it can't answer this in two clicks, reporting is weak.
-
"Which integrations are native vs. built through a third-party connector?" Third-party connectors break. Native ones usually don't.
-
"What's your actual uptime over the last 90 days, with the number?" Vague answers are a tell.
-
"If I leave in a year, what exactly do I get, and in what format?" The reaction matters as much as the answer.
-
"How are price increases communicated and capped?" Protects you from the renewal surprise.
-
"Can I test this with my own client list during a pilot?" If no, that's a problem in itself.
Write down their answers verbatim. Patterns emerge fast when you compare two vendors side by side on the same questions.
Three red-flag dealbreakers
Some issues aren't "score it lower" problems. They're walk-away problems. If you hit any of these, stop.
-
Your data can't leave cleanly. If the only export is a partial CSV missing service notes, photos, or membership status, you don't own your business data — they do. This is the one that ruins owners years later.
-
Pricing scales in a way you can't predict. Per-chair pricing that jumps, "contact us for enterprise" tiers with no numbers, or add-ons that are really core features sold separately. If you can't model your cost at double your current size, assume the worst.
-
No real support during business hours. A barber shop runs on same-day bookings. If support is email-only with a 24-hour response window, a Saturday outage means a day of lost revenue and a lobby full of annoyed clients. Test support before you buy — send a question during the trial and time the reply.
If you hit any of these, stop.
A one-month pilot plan
Week 1 — Setup and baseline. Import a real slice of data — not the whole shop, but enough to be realistic. Your busiest barber's clients, for instance. Record your current numbers: booking fill rate, no-show rate, average checkout time, add-on attach rate. You need the before to judge the after.
Week 2 — Live on one chair or one day. Run the software for real on a limited scope. One barber, or every Tuesday. This contains the risk while generating genuine data. Watch for friction: how many taps to book, how clunky is checkout, do staff resist it.
Week 3 — Expand and stress-test. Add a second chair or a second day. Deliberately trigger edge cases: a refund, a no-show, a double-booking attempt, a last-minute cancellation. This is where polished demos fall apart.
Week 4 — Measure and decide. Compare your pilot numbers to baseline and score each vendor against your matrix one more time, now with real evidence instead of demo impressions.
Pilot success metrics
-
Booking fill rate
did it hold or improve vs. baseline?
-
Checkout time
faster, slower, or the same?
-
Staff adoption
are barbers using it willingly, or working around it?
-
No-show rate
any movement from reminders or memberships?
-
Add-on attach
did POS prompts change behaviour at all?
-
Support responsiveness
how fast did they answer your test questions?
A pilot that improves even two of these meaningfully, with staff actually using the tool, is a strong signal. Flat numbers plus complaining staff is a clear no, regardless of how good the demo looked.
Send a real support query during the pilot and time the response.
A pilot that improves even two of these meaningfully, with staff actually using the tool, is a strong signal. Flat numbers plus complaining staff is a clear no, regardless of how good the demo looked.
A simple cost‑benefit worksheet
Payback math doesn't need to be fancy. Two columns: what it costs, and what it returns.
Costs (monthly):
-
Subscription (all tiers and per-chair fees included)
-
Payment processing difference vs. current provider
-
Setup / migration (amortize a one-time cost over 12 months)
-
Staff training time (hours × wage)
Returns (monthly estimate):
-
Recovered bookings from online/after-hours capture
-
Reduced no-shows (no-shows avoided × average ticket)
-
Add-on attach lift (extra attach rate × transactions × product margin)
-
Admin time saved (hours × your effective hourly value)
A realistic example. A 5-chair shop pays around $180/month for software, plus roughly $40/month in migration amortization — call it $220 in total cost. On the return side, online booking recovers maybe 8–12 appointments a month that would've slipped through voicemail, at an average ticket near $35. That's $300–$420 right there. Reminder flows trim no-shows by a handful a week, recovering another couple hundred. Even before touching retail attach, the tool roughly pays for itself. The margin case gets stronger once POS prompts nudge add-on sales, which is where a tight retail merchandising SOP turns a software feature into actual revenue.
The point of the worksheet isn't precision. It's to catch the shops where the math doesn't work — where a slick platform costs $400/month and recovers maybe $150 in value. That's a surprisingly common situation, and this framework is how you avoid it.
When this framework matters most — and when it doesn't
When it's worth the effort: You're running 3+ chairs, switching off a tool you've outgrown, or opening a second location. The stakes are high enough that a bad choice costs thousands and months of pain. Score everything, run the pilot, do the math.
When you can move faster: You're a solo barber on your first system. You don't need a weighted matrix across ten vendors. Solid online booking, fast payments, and clean data export is basically the whole requirement. Pick from a short list, run a two-week trial, done.
Who should slow down: Anyone being pushed to sign an annual contract before a pilot. Anyone who can't get clear pricing at double their current size. Anyone whose "must-have" list is really a "the salesperson made this sound cool" list. Mapping features to KPIs exists specifically to separate what moves money from what moves your emotions in a demo.
One more thing worth saying: software enforces systems, it doesn't create them. A scheduling tool can't fix a shop with no scheduling discipline. A loyalty engine can't fix clients you've given no reason to return. No POS prompt sells an add-on the barber doesn't believe in. The best barber shop management software amplifies good operations and exposes bad ones. If your underlying systems are shaky — consultation workflows, service consistency across barbers, the way you handle diverse hair textures and the pricing around them — fix those first, or the software just automates the mess faster.
Run the matrix. Weight it for your actual shop, not the shop you'll have in five years. Break the demo with hard questions. Pilot on real chairs with real numbers. Let the KPIs — not the feature count — pick the winner.
Ready to elevate your barbershop operations?
Join 500+ barbershops using Trimzly to save time, reduce scheduling conflicts, and enhance client satisfaction.